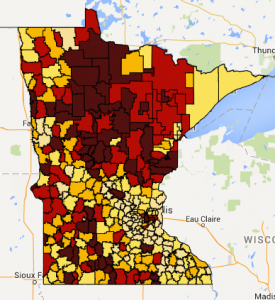
MREA released a map today on family income and child poverty in Minnesota’s school districts by means of free and reduced lunch meals. Fifteen Greater Minnesota school districts have FRE percentages of 67 percent or more. A thumbnail is below. View the interactive map.
Free & Reduced Meals
 Free and Reduced (FRE) meals are provided to families who qualify by Federal Guidelines. Families of four earning less than $44,123 (185 percent of Federal Poverty) are eligible.
In Minnesota families that qualify receive free meals because Minnesota allocates $3.5 million annually in state funds to make up the difference in Federal Funds for families that qualify for reduced price meals under the Federal guidelines. (Families of four earning between $23,850 and $44,123 annually).
Families need to apply for Free and Reduced meals, so there may be some degree of under reporting. However the patterns in this map of FRE is confirmed by an analysis by Kids Count of U.S. Census, American Community Survey (ACS) data showing children’s poverty by Congressional Districts.
| Minnesota Congressional District (113th Congress) | Percent of Children Living Below 200% of Poverty* | Number of Children Living Below 200% of Poverty |
| 5 | 48% | 67,000 |
| 4 | 40% | 64,000 |
| 7 | 38% | 58,000 |
| 8 | 40% | 55,000 |
| 1 | 33% | 51,000 |
| 2 | 26% | 45,000 |
| 6 | 26% | 45,000 |
| 3 | 20% | 34,000 |
*The share of children under the age of 18 in families of four earning less than $47,248.
Key Findings
- The map reveals three distinct areas:
- The core cities and seven inner ring suburbs have an average FRE percentage of 64 percent (Congressional Districts 4 and 5)
- Greater Minnesota school districts have an average FRE percentage of 42 percent(Congressional Districts 1, 6, 7 and 8)
- The remaining suburbs within the seven county metro have an average FRE percentage of 26 percent (Congressional Districts 2, 3 and 6)
- Fifteen Greater Minnesota school districts have FRE percentages of 67 percent or more.
- 87 percent of the Greater Minnesota schools districts with high FRE percentages serve a significant percentage of AMI students.
Key Questions
- Is Minnesota doing enough to provide equal educational opportunity statewide when the number one predictor of academic achievement and educational attainment is household income? (Family Income and Educational Attainment 1970-2009)
- How can Minnesota improve educational outcomes for students for whom poverty and non-majority cultural status combine into great educational gaps such as for American Indian Students who have the lowest graduation rate and largest gap of all Minnesota’s sub-groups? Read more

