By Fred Nolan, MREA Executive Director
Students in Greater Minnesota demonstrate stronger proficiency rates in all areas tested in the 2017 Minnesota Comprehensive Assessment (MCA) compared to two years ago, according to a report from MREA.
MREA released today a regional analysis of 2017 MCA test results in math, reading and science from the Minnesota Department of Education (MDE).
Science leads the way with a 3 percent jump while proficiency in reading and math increased 1 percent.
These increases are widespread across Greater Minnesota. In a regional analysis of each subject ‘gainers’ led ‘no change’ and ‘losses’ by a 3:1 margin in the Greater Minnesota regions. View the regional analysis.
Students in five regions in Greater Minnesota demonstrated growth in all three subjects between 2017 and 2015. View regional data analysis
| Region # | Description |
| 3 | Arrowhead |
| 6E | East Central |
| 7E | Central |
| 7W | SW Central |
| 8 | Southwest |
The Twin Cities metro region showed no change in all three subjects. As a result, the gap between rural and metro achievement narrowed to less than 1 percent in each subject.
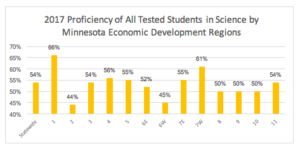
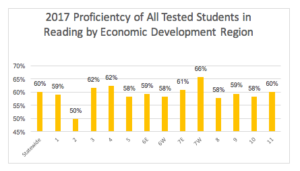
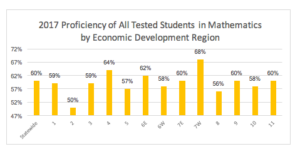
Proficiency Rates by Region
Despite the sustained growth in MCA scores, only two Greater Minnesota regions outperform the state in all three subjects: Regions 4 (West Central) and Region 7W (Central).
Four regions underperform the state in all three subjects, and six regions show a mixed picture.
While the schools in Regions 4 and 7W add value, it must also be noted that their counties for the most part are above the median household income.
Learn more about median household income in your district.
Benchmarking
Benchmarking and tracking achievement gains in one’s districts as compared to benchmarked districts is a proven strategy to generate achievement gains in a school district.
Regional benchmarking for many districts is more reflective of trends within the region and a better measure of district growth than the statewide average.
For more information on the 2017 MCA results:
- MDE provides a good powerpoint of 2017 MCA statewide results with racial and economic gaps in achievement. View a slide presentation summarizing the 2017 MCA results.
- Find results for your school and district at Minnesota Report Card.
- The data for this regional analysis and for more detailed benchmarking information is found in the Assessment and Growth files at MDE Data Analytics.
- For economic and demographic information by county in Minnesota, visit the Center for Rural Policy and Development Atlas.


