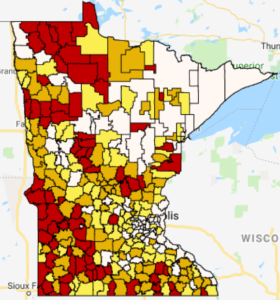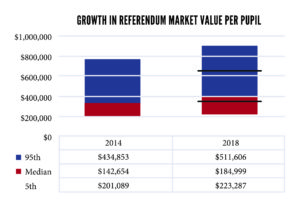
Minnesota faces an increasing rural-metro disparity in local Referendum Market Value (property wealth1) per pupil with Greater Minnesota lagging the metro by 51 percent, according to a new map released by MREA.
The map shows patterns in Referendum Market Value by Residential Pupil Units as a measure of Minnesota school district property wealth in the past year.
To better understand the Referendum Market Value per Resident Pupil Unit (RMV/RPU) of a district and the overall state picture, view the interactive map.
KEY FINDING #1
Greater Minnesota lags the metro in RMV/RPU by 51% when calculated on a per pupil basis.
| Rural Household Income, Property Value and Operating Referendum Lag Metro in all Three Measures of Wealth and Revenue | |||
| Median Household Income (2017) | Referendum Property value per Pupil (’18-’19) | Referendum Revenue above Basic Formula (’18-’19) | |
| Statewide | $65,699 | $583,835 | $1,371 |
| 7-County Metro | $80,595 | $667,210 | $1,638 |
| Rural | $55,476 | $441,224 | $955 |
| Metro/Rural Funding Difference | ($25,119) | ($225,986) | ($683) |
| Metro/Rural Difference as Percentage of Rural Base | 45% | 51% | 72% |


