MREA released today a regional analysis of 2019 Minnesota Comprehensive Assessment (MCA) results in reading and math. It is a very different story for the two subjects.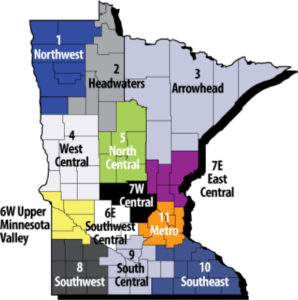
- In reading, Greater Minnesota students in 2019 are demonstrating stronger proficiency rates than in 2015 with nine of the 12 regions in Greater Minnesota showing gains.
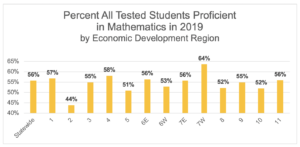
- In math, only five of Greater Minnesota regions met or exceeded the state average of 56 percent and statewide math achievement has fallen 4 percent in the past five years.
The MCA is statewide testing used to measure achievement. These tests are given to students in a district once a year, based on their grade level and subject area. The results by school district are provided by the Minnesota Department of Education (MDE).
Reading
In reading, Greater Minnesota students in 2019 are demonstrating stronger proficiency rates than in 2015. Students in nine of the 12 Greater Minnesota regions have improved their reading proficiency.
Regions 1 and 3, Northwest and Arrowhead, lead the advancements with 4 percent increases over those five years.
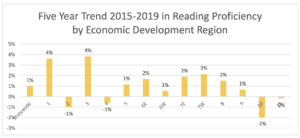
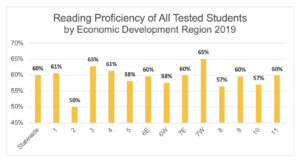
Students in seven Greater Minnesota regions are now performing equal or above the state average of 60 percent proficiency in reading. The metro region showed no appreciable change in reading proficiency and is performing at the state average.
 Math
Math
Mathematics student achievement is a very different and troubling picture. Statewide student achievement has dropped 4 percent in the past fives year, between 2015 and 2019.
Only one region bucked that trend, Region 3, Arrowhead, but just barely at a 1 percent growth.
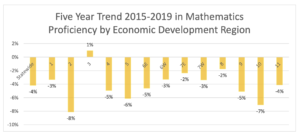
Only five of Greater Minnesota regions met or exceeded the state average of 56 percent in 2019, led by Region 7W, Central, at 64 percent.
The metro region mirrored the state both in the decline of proficiency between 2015 and 2019 and in the 2019 average proficiency of 56 percent.
Benchmarks & Resources
Benchmarking and tracking achievement gains in one’s districts as compared to benchmarked districts is a proven strategy to generate achievement gains in a school district. Regional benchmarking for many districts is more reflective of trends within the region and a better measure of district growth than the state-wide average.
For more information on the 2019 MCA Test results and factors affecting student achievement:
- Find results for your school and district at Minnesota Report Card.
- The data for this regional analysis and for more detailed benchmarking information is found in the Assessment and Growth files at MDE Data Analytics. Choose All Accountability Tests
- The Star Tribune compared MCA scores to poverty levels and produced an interactive lookup table where you can see if your school is “Beating the Odds.” (Star Tribune 9/5/19)
- The increase in students opting out MCA Tests (Star Tribune 9/14/2019)
- Minnesota Department of Education (MDE)’s 2019 State of Our Students report,
- For economic and demographic information by school district in Minnesota, visit https://www.mreavoice.org/maps/


