
House Tax Chair Paul Marquart has brought forth a bill to increase the Ag2School Bond…
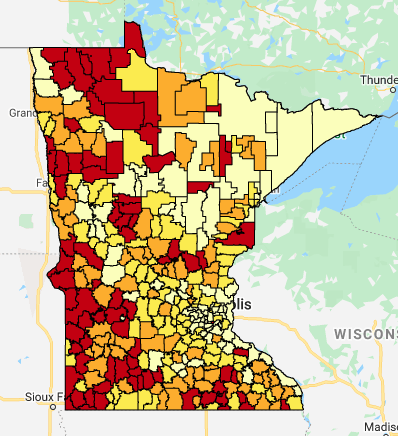
What does Compensatory Revenue look like under the Governor’s January 2025 proposal? How much would each school district receive in Compensatory Revenue?
What does Compensatory Revenue look like under the current law with direct certification? How much will each school district receive in Compensatory Revenue?
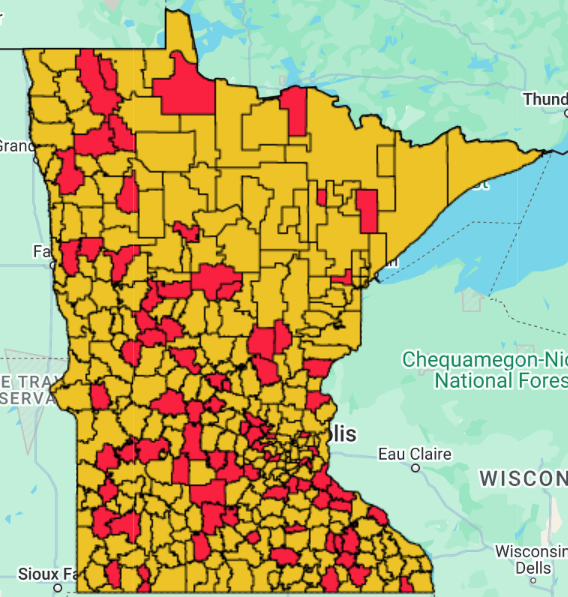
With the 70% percent credit for Ag2School, what does funding look like for Minnesota districts?
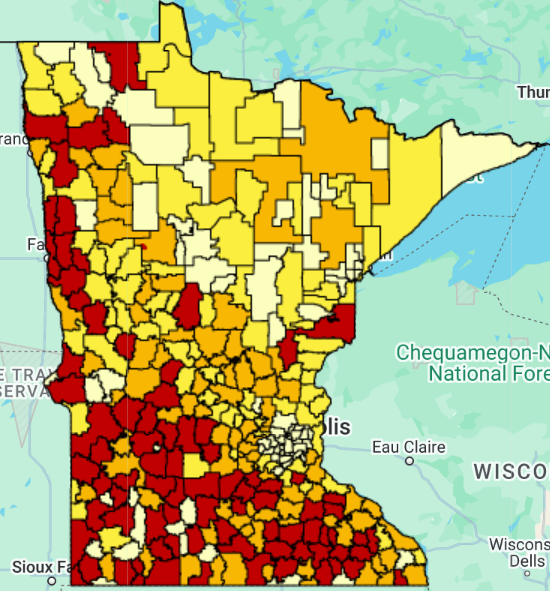
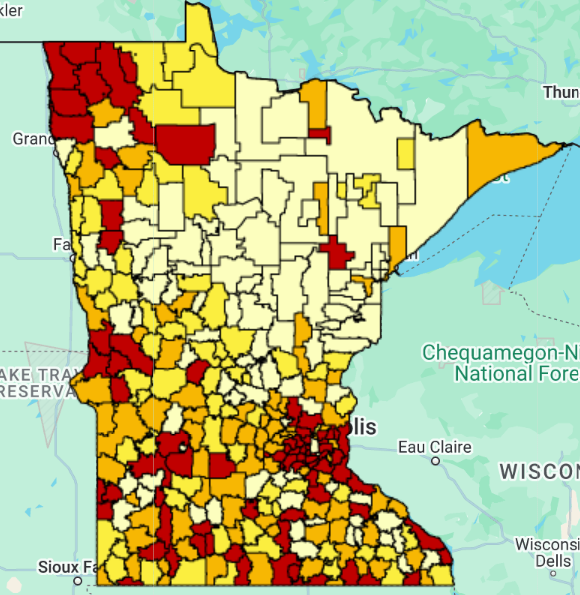
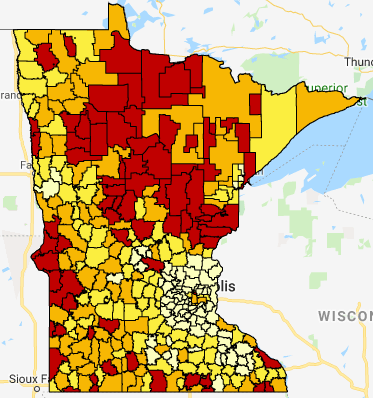
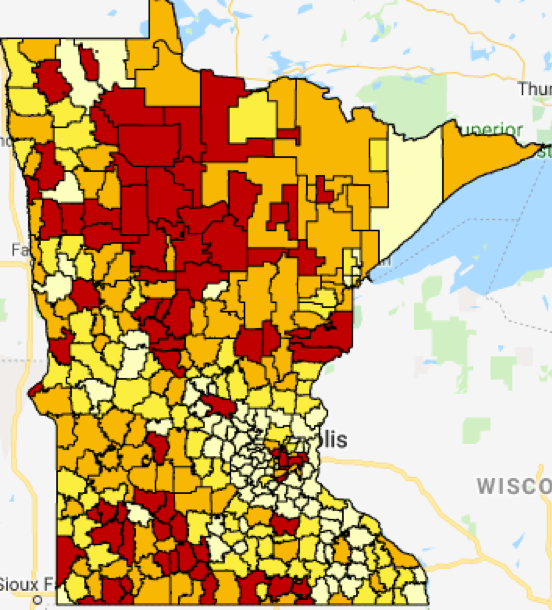
Patterns in Referendum Market Value by Residential Pupil Units as a measure of Minnesota school district property wealth in 2025.
How has school operating revenue changed statewide? What’s the impact per Adjusted Pupil Unit?
How much did each school district receive in ESSER funds? What is the per pupil amount? What can districts spend their funds on? How is the amount determined?
How has school operating revenue changed statewide? What’s the impact of Local Optional Revenue and Board Authorized Referendum Revenue?
Patterns in Referendum Market Value by Residential Pupil Units as a measure of Minnesota school district property wealth in 2021.
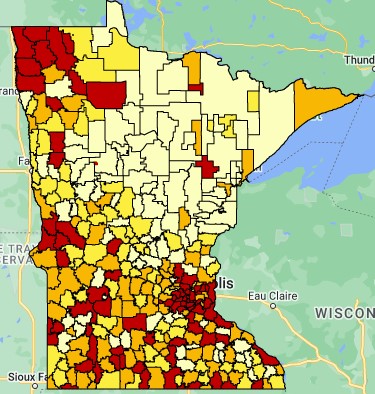
There’s a wide rural-metro divide with the state’s wealthiest district’s median income more than five times the amount of the poorest district.
Family income and child poverty in Minnesota’s school districts by means of free and reduced lunch meals. Fifteen Greater Minnesota school districts have FRE percentages of 67 percent or more.
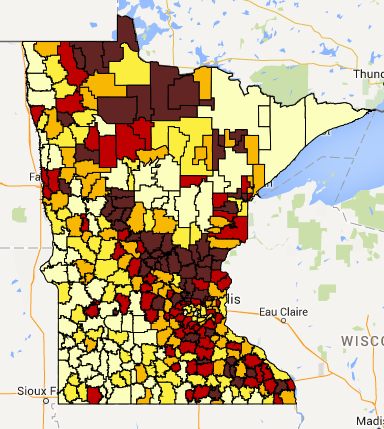
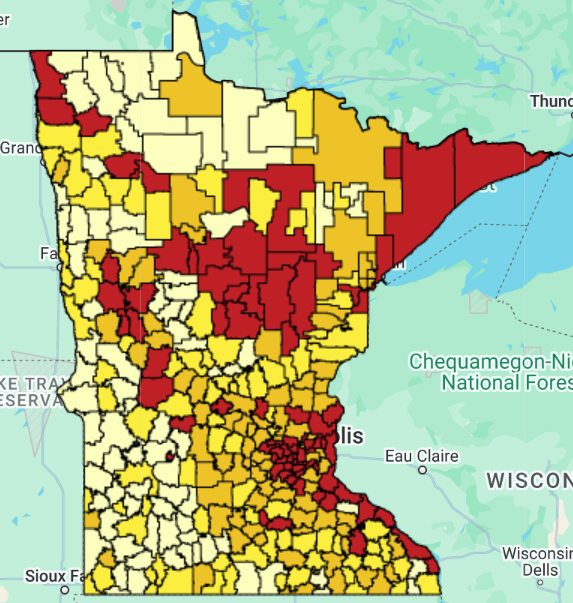
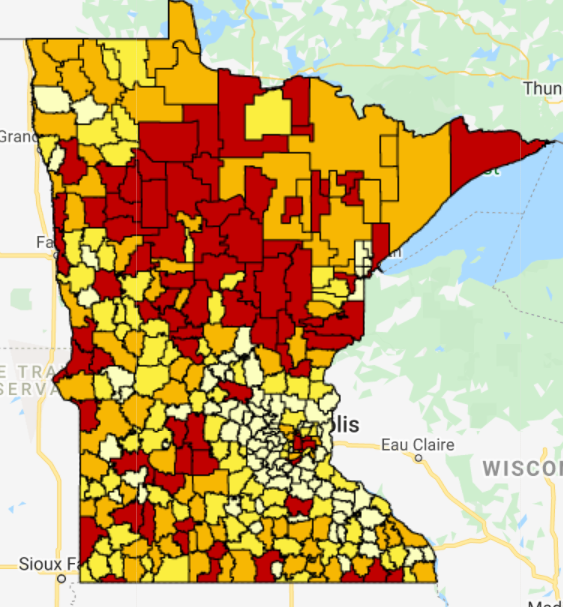
Patterns in ANTC/APU as a measure of Minnesota school district property wealth in 2017.
House Tax Chair Paul Marquart has brought forth a bill to increase the Ag2School Bond…

Minnesota’s new Ag2School 40 percent tax credit has nearly tripled the state share of school…
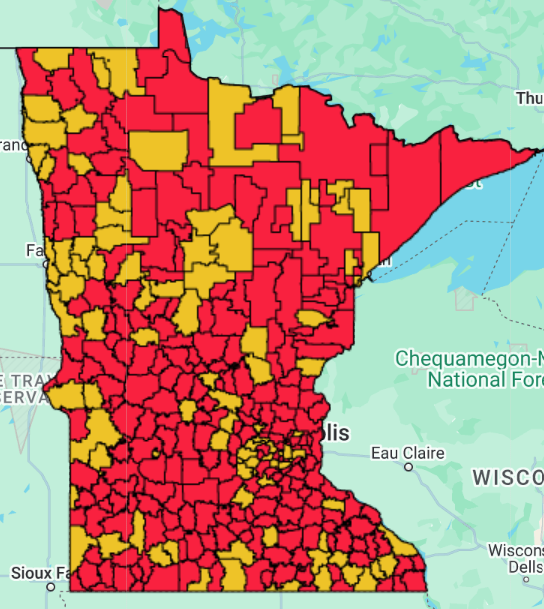
Where are the districts that have schools with Q Comp? Which districts have added Q…
The equalization of Local Optional Revenue does not reach some of the poorest school districts…
MREA released a map today illustrating median household income by school district in Minnesota. The…
MREA released a map today that illustrates patterns in ANTC/APU as a measure of Minnesota school…
MREA released a map today on family income and child poverty in Minnesota’s school districts…
MREA released a map showing patterns in Referendum Market Value by Residential Pupil Units as…
Where are the students going, where are they coming from, in Minnesota’s Open Enrollment? MREA…
MREA released a map today on the Adjusted Net Tax Capacity (ANTC) per ADM.This map…