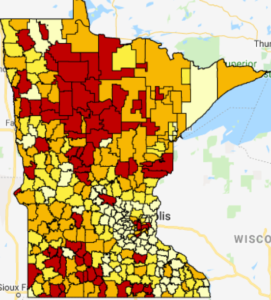
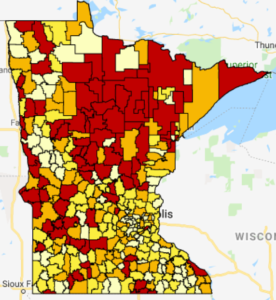
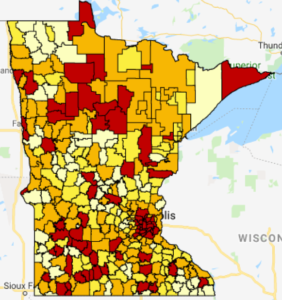
MREA released three maps of student demographics from the just completed 2018-19 school year that undergird policy and funding decisions to be made at the State Capitol. Learn more about the patterns and policy and funding implications of each of the following below:
- Students Eligible for Free and Reduced Lunch
- Students Receiving Special Education (SPED) Services
- Students of Color (White Non-Hispanic Students and the Inverse)
Free and Reduced Lunch
 Parts of rural Minnesota have the highest district-wide percentages of students eligible for Free and Reduced Lunch (FRE). The Twin Cities suburbs have among the lowest percentages of students eligible for FRE.
Schools districts highlighted in red and orange exceed the state median percentage for students eligible for Free and Reduced Lunch. Those districts in red have the highest percentages of FRE students in the state.
Minnesota’s Compensatory Education Funding is based on FRE percentages by school site. This important funding stream brings a degree of equity to rural and urban students. MREA has consistently supported Compensatory Education at the Minnesota Legislature.
Special Education
 Parts of rural Minnesota have school districts with the highest percentages of students receiving Special Education (SPED) services. Now 75 Greater Minnesota school districts (74 rural districts and St. Cloud) provide SPED services to 19 percent or more of their students, as shown in red on the map. Schools districts highlighted in orange also exceed the state median percentage of students receiving SPED services.
South St. Paul is the highest Twin City Metro district at 19%. However, this is somewhat misleading due to the four robust Intermediate Districts in the Twin Cities that provide SPED services to member school districts. The MDE demographic data is organized by the serving district, not the resident district.
Why does this matter?
- The four Twin Cities Intermediate Districts have financial tools to build and maintain appropriate facilities and programs for member districts’ most needy students that rural cooperatives and Education Districts lack. MREA has been bringing this to the attention of legislators for three years and will do so again vigorously in 2020. Learn more.
- There is not a strong relationship between percent of students receiving SPED services from a district and the district’s SPED Cross Subsidy. (The R2 is only 7%). Statistically, 93% of the factors affecting districts’ Cross Subsidies are other than the number of students a district directly serves. MREA will be addressing SPED cross subsidies in the Fall Member Meetings.
- The most significant teacher shortages are in rural special education. The large number of rural districts needing to provide SPED services to above the median percent of students bring this SPED teacher shortage into clear focus. Learn more on teacher shortages.
Students of Color
 Minnesota’s students ethnic and racial demographics are changing but not in a single, monolithic way. This creates challenges in many ways for state policymakers as well as for school district leaders and teachers.
One quarter of Minnesota’s school districts have more than 25 percent students of color. St. Paul, Minneapolis and the immediate surrounding suburbs uniformly fit this pattern.
Greater Minnesota has school districts with all levels of diversity, but nearly all districts with more than 89 percent white non-Hispanic students are in rural Minnesota.
This matters because some of the greatest teacher shortages are in rural Minnesota. MREA has supported teacher loan forgiveness and other programs to grow the teacher workforce across Minnesota and will continue to do so in the 2020 legislature.
Plan to attend an upcoming Fall Member Meeting to provide your input on strategies to increase the supply and retention of new teachers. Learn more on teacher shortages.


