Minnesota’s large amount of agriculture and timber land has impacted the funding schools receive from communities for their facilities and led lawmakers to take steps to provide support to taxpayers and students. The latest change in the Ag2School tax credit increase will go into effect this year as it provides owners of agriculture and timber land a 50 percent credit on school bonds.
Why is this needed and who will be impacted? MREA dug into the data and today released three interactive maps showing the results:
Where’s the highest concentration?
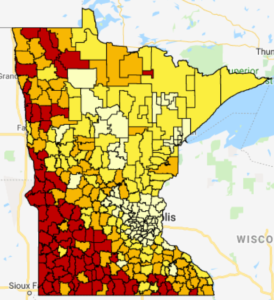
 The highest concentrations of agriculture and private timberland as a percentage Net Tax Capacity (NTC) are in western Minnesota, as shown in red in the map to the right.
- The statewide median percentage is 27.5 percent.
- One-quarter of the school districts have over 64 percent of their NTC in agriculture or timber land.
The school districts highlighted in red and orange exceed the median.
How does it impact school district wealth?
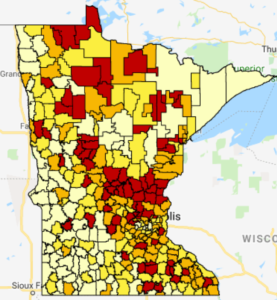
 The concentration of agriculture or timber land in rural districts creates higher district wealth under the traditional method for measuring district wealth per pupil: Adjusted Net Tax Capacity (ANTC) per Student (APU) as can be seen in the map to the left.
The school districts shown in red have the lowest wealth in Adjusted Net Tax Capacity per student. The orange colored school districts follow, fairing better but still falling below the statewide median.
The districts highlighted in light and dark yellow exceed the statewide median.
How does Debt Service Equalization help?
Debt Service Equalization (DSE) has been the traditional approach to providing a state share of facility bonds in Minnesota. The factors for the equalization are based on this measure of district wealth (ANTC/APU).
With current law, school districts must have a debt burden above 15.74 percent of their ANTC and have less wealth than $4,598 ANTC per APU to qualify for Tier 2 aid, and a debt burden above 26.24 percent of their ANTC with a wealth of under $8,311 to qualify for Tier 3. The equalizing factors of $4,598 and $8,311 are in indexed to the average ANTC per pupil.
- Only 34 districts in the state met these qualifications for Tier 2 or 3 equalization aid in FY ’19.
- The $19.9 million in state equalization represents 2 percent of the annual school district bonded debt payments.
- About 51 percent of DSE supports school bonds in two school districts: St. Michael Albertville and Farmington. Both of these districts have had rapidly growing student populations with relatively low property wealth.
How will the 50% Ag2School tax credit help?
Because many high wealth districts in this measure (ANTC/APU) also have high agriculture and timber land percentages with smaller student counts, Ag2School was conceived and passed in 2017 to increase the state share in districts in which farmers were paying an outsized portion of districts’ facility debt. Learn more
The Ag2School Ag Bond Credit will increase from 40 percent to 50 percent in Pay ’20. This is on all existing Fund 7 debt levies excluding OPEB bonds.
- This will reduce bonded debt taxes for holders of agriculture and timber land in 296 school districts.
- The median reduction per district is $26,568 and $35 per $500,000 in agriculture and timber land.
- The increased reduction totals $10.9 million.
- The median credit per $500,000 in value is $175 with the 50 percent Ag2School credit.
 What is the impact of the 50 percent credit by school district?
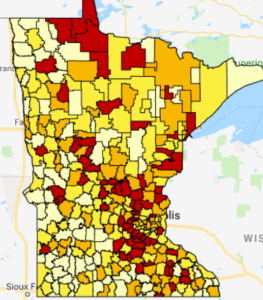
MREA developed this interactive map that shows the Ag2School 50% tax credit on school bonds per $500,000 in agriculture and timber land.
Those in the red are most impacted by the increased tax credit, followed by those in orange.
View a district run of the change and 50% credit effect on $500,000 in agriculture and timber land.
Ag2School Phases to 70%
The Ag2School tax credit on school bonds will increase to 70 percent over the next three years. This is permanent law enacted through the tax bill by the Minnesota Legislature.
| Taxes Payable Year |
Percent Increase in Ag2School |
Total Ag2School Credit Percent |
| 2021 | 5% | 55% |
| 2022 | 5% | 60% |
| 2023 | 10% | 70% |
It would take action in both the House and Senate and a signature by the governor to not have these scheduled increases take place.


