Six rural regions show the greatest teacher shortages and special education and early childhood lead the gaps statewide, according to a new teacher supply and demand report released this week.
The report hones in on geography, license area and teachers of Color or American Indian as the factors driving teacher shortages in Minnesota.
Minnesota Professional Educators Licensing & Standards Board (PELSB) released the 2019 Biennial MN Teacher Supply and Demand. PELSB “examined the area where teachers worked under special permissions or out of compliance…” The implicit assumption is that where there are more special permissions or teachers assigned out of compliance with teacher licensing regulations there is greater shortages. PELSB reported the special permissions by the 13 Regional Economic Development Regions (EDRs).
A key finding of the report, which the media covered , is that slightly over half of teachers holding an active license (52.5 percent or 70,316) are not teaching. Yet, 10,750 (15 percent) of these individuals hold licenses in elementary education, social studies or English, according to the report’s appendix. These are three out of the four easiest areas to rural superintendents report the least difficulty in recruiting.
The report found that 25 percent of 2016-17 teachers did not continue teaching in 2017-18 for what are reported as personal reasons. This confirms a troubling trend that teachers are leaving the field especially in their first five years of teaching and similar findings reported in Minnesota’s Teacher Crisis, MREA, 2016
This trend needs more investigation to determine the underlying causes and possible solutions.
Geography
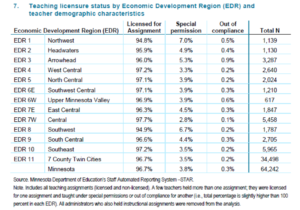 Six of the state’s regions had between 4.4 percent special permissions and 7.0 percent (Northwest, Headwaters, Arrowhead, East Central, Southwest, and South Central). The 7-county Twin Cities region had 3.5 percent special permissions.
License Area
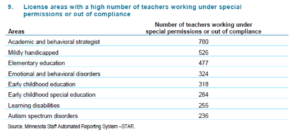
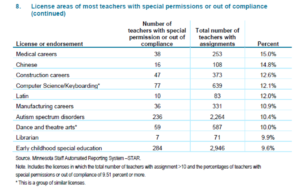
Special education and early childhood lead the number of special permissions. But by percentage, Career & Technical Education (CTE) and world languages lead the list, as shown by these charts.
Teachers of Color
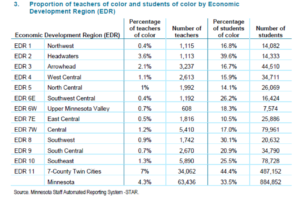
The report shows the gap in the proportion of teachers of Color and American Indian (4.3 percent statewide) as compared to the proportion of students of color and American Indian (33.5 percent). This gap is evident in every EDR of the state, as shown by this chart.
Recruitment & Retention
The report provided good results from school districts taking specific steps to recruit and retain standard licensed teachers. Of the school districts responding to the survey, in recruiting teachers,
- 50% reported that providing competitive salaries had made some or a very big difference
- 45% reported that creating a pipeline program (residency models, grow your own made some or a very big difference
School districts reported even bigger effects in the following specific steps to retain standard licensed teachers.
- 69% reported that providing mentorship programs made some or a very big difference
- 73% reported that providing professional development opportunities did the same
- 67% reported that offering promotions or increased salaries did the same
Unfortunately these results were not replicated when districts used them to recruit or retain teachers of Color and American Indian.


