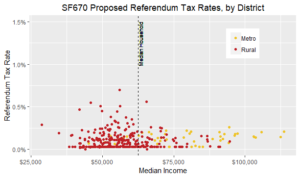
Many rural school district taxpayers pay especially high referendum tax rates and those same rural districts have below the state median household incomes. There is a $630 gap in median operating referendum revenue per pupil between metro districts ($1,142 per pupil) and rural districts ($512), 10% of the formula, according to a MREA analysis released today. Learn more about gaps in Referendum Revenue.
Proposed legislation, HF608/SF670, would increase tax equity, transparency, and the state’s share of the operating referendum by limiting the maximum tax rate required to raise the same operating revenue per student. View Issue Brief.
Where We Stand
Wide Rural Variation
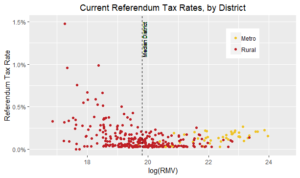
While the median tax rate rural and metro are not significantly different, the rural distribution varies widely. The variation of rural (standard deviation of 0.6%) is nearly 10 times that of metro (0.08%).
 Rural Taxpayers Pay More
Many rural districts pay especially high referendum revenue tax rates.
- 29 Rural Districts (10%) have a Referendum Tax Rate of 0.33 or greater vs. 2 Metro Districts (4%)
- 46 Rural Districts (17%) have a Referendum Tax Rate of 0.25% or greater vs. 3 Metro Districts (6%)
Lower Household Income
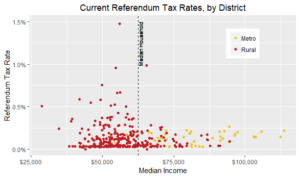 Greater Minnesota homeowners have a significantly lower median household income than their metro counterparts. Learn more on the median household income gap
Since rural districts have lower median household incomes, these higher tax rates are in districts below the state district median household income ($62,590) when weighted for the number of pupils in each district.
Property Wealth
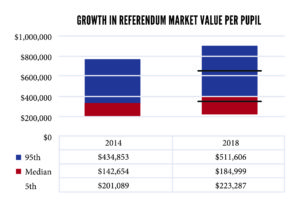 Underlying these difference in tax rates are that metro districts have 67% referendum property wealth than rural districts. This gap has grown significantly in the last four years.
With a larger tax base, it takes a lower tax rate to raise the same amount of revenue to educate students. Learn more on Referendum Market Value (RMV).
This rural-metro inequity exists despite the current approach to operating referendum equalization using equalization tiers of $880,000, $510,000, and $290,000 in referendum market value per resident pupil unit (RMV/RPU).
Proposed Legislation
HF608/SF670 (Runbeck/Chamberlain) aims to treat taxpayer as a taxpayer, regardless the number of students who are educated in a district. It cost about $25.2 million not affect Local Operating Revenue (LOR).
Here’s how it works:
- Creates a maximum tax rate for the equalized portion of operating referendums of 1% of RMV for every $100 per pupil in authorized revenue to an upper limit of 15% for $1,579 per pupil (25% of formula).
By Tier it works like this:
Tier 1: $100-$300 Max RMV rates 1% to 3%
Tier 2: $300-$760 Max RMV rates 4% to 8%
Tier 3: $761-$1,579 Max RMV rates 9% to 15% - Creates a smooth formula with no steps or cliffs in the state share of the equalization formula.
- Current equalization tiers of RMV/RPU of $880,000, $510,000, and $290,000 becomes base or minimum. If a district does better under the Tiers, that is the equalization formula for them.
What’s the Impact?
#1 Tax Equity
Creates tax equity by dramatically lowering the highest tax rates to raise the same dollars to educate students.

 #2 Reductions for Taxpayers
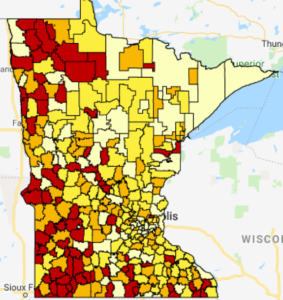
This legislation lowers the operating referendum tax burden for homeowners and businesses in 261 school districts.
In 37 rural school districts, the reductions are over $100 per $150,000 homestead. The statewide median reduction is $12 per $150,000 homestead.
The map to the left shows the effect of SF670/HF618 on $150,000 homestead. Those highlighted in red would see the greatest reductions. View Interactive Map
View Spreadsheet of Impact by District
#3 State Supports Greatest Need
Provides a greater state share of operating referendums in districts with below median district household incomes.
#4 Increased Transparency
Increases the transparency of Operating Referendum Taxes and ability to explain school district taxes in Truth in Taxation hearings. The total amount of dollars raised to educate kids divided by the total referendum property wealth of the district creates a rate. The state’s share is the amount above a maximum local tax rate for the dollars raised peer student.
HF608/SF670 Effect by District Strata |
|||||
| PUPILS | REF MARKET | BASE LOCAL | PROPOSED LOCAL | INCREASED | |
| NAME | (APU) | VALUE PAY 20 | EQUALIZED LEVY | EQUALIZED LEVY | STATE SHARE |
| STATE TOTAL | 963,789 | 566,927,259,545 | 753,316,908 | 728,190,754 | (25,126,154) |
| MPLS & ST PAUL | 74,351 | 78,187,227,490 | 96,019,515 | 96,019,515 | 0 |
| OTHER METRO, INNER | 96,961 | 81,621,057,800 | 133,137,883 | 130,793,219 | (2,344,664) |
| OTHER METRO, OUTER | 300,107 | 209,955,884,211 | 346,164,163 | 338,630,684 | (7,533,479) |
| GREATER MN >= 2K | 222,540 | 116,487,476,852 | 101,437,092 | 97,503,394 | (3,933,698) |
| GREATER MN 1K-2K | 91,264 | 39,698,201,488 | 25,346,458 | 22,843,004 | (2,503,454) |
| GREATER MN < 1K | 99,909 | 40,977,411,704 | 51,211,797 | 42,400,937 | (8,810,860) |
| ALL DISTRICTS | 893,077 | 566,927,259,545 | 753,316,908 | 728,190,754 | (25,126,154) |
| ALL METRO DISTRICTS | 471,419 | 369,764,169,501 | 575,321,561 | 565,443,419 | (9,878,142) |
| ALL GREATER MN DISTRICTS | 492,370 | 197,163,090,044 | 177,995,347 | 162,747,336 | (15,248,011) |


