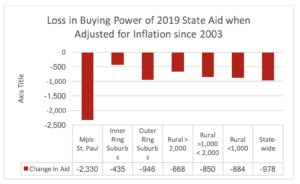
Minnesota school districts of all sizes lost buying power in state aid since 2003 when adjusted for inflation, according to an MREA analysis released today of the Northstar Institute’s School Revenue Trends Report. Greater Minnesota districts on average lost between $668 for districts greater than 2,000 students to $884 for districts with fewer than 1,000 students.
The analysis accounts for inflation and uses the Minnesota Department of Education’s Tiers of districts.
Schools have never caught up to the freezes in state aid between 2004-2012. Minneapolis and St. Paul also experienced changes in formulas that negatively impacted their total state aid during that same time. When averaged by Tiers, all districts in all Tiers lost buying power as can be seen in this chart.
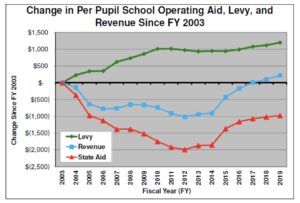
The overall state picture looks like this throughout the 2003-2019 time period, as reported by Northstar Institute in fall 2017.
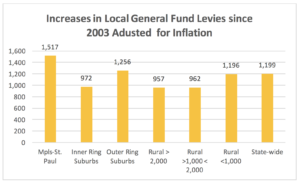
Districts of all sizes have had increases in local levies, the largest increases being in the core cities and the outer ring suburbs. The largest portion of local levies are operating referendum levies. As of FY 2017, the district median operating referendum (including Local Operating Referendum and Board Authorized Referendum Revenue) was $930 per pupil.
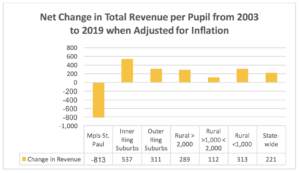
The combination of losses in state aid buying power and increases in levies has brought all districts except Minneapolis and St. Paul small real increases in their buying power.
The largest is in the Inner Ring Suburbs that experienced a 4.3 percent increase over 16 years or 0.27 percent per year. The smallest are Greater Minnesota school districts with between 1,000 and 2,000 students, which saw a 1.01 percent over 16 years or an infinitesimal 0.06% percent per year increase.
As a result, here is where Minnesota school districts find themselves facing their budget building season for the 2018-19 school year—exclusive of the 48 district seeking operating referendum renewals or increases.
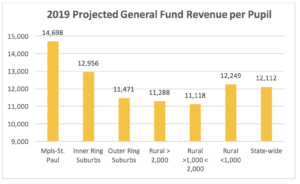
This analysis is done by school district averages using MDE’s Tier analysis of districts and affect 100,000’s of thousands of Minnesota’s children as can be seen in the chart below on the numbers of school districts and students in each Tier.
| Tier | Region Description | Number of Districts | Number of Children (APU) |
| 1 | Urban Center | 2 | 73,176 |
| 2 | Inner Ring Suburbs | 13 | 87,923 |
| 3 | Outer ring suburbs | 34 | 265,053 |
| 4 | Rural > 2,000 | 42 | 185,112 |
| 5 | Rural 1,001-1,999 | 82 | 95,796 |
| 6 | Rural < 1,000 | 172 | 86,283 |
| State Totals | 335 | 845,255 |
School leaders are free to use these charts and information as long as they credit the Northstar Institute and MREA. The Northstar Report has information for each school district.
With PDF Professional or the free Snipping Tool, school districts can extract the charts and information to shared. Should you want MREA to do that for you, send your request to info@mreavoice.org.
MREA partnered with the Northstar Institute and author Jeff VanWychen for this important and informative analysis and report.


