
Enrollment Numbers Impact Funding
MREA is regularly asked why school districts are cutting budgets this year even though they received substantial funding from the 2023 Legislative Session. This conversation has many facets, including:
- the state not keeping up with inflation
- the inability of districts to pass operating referendums,
- much of the money of the last session was focused on categorical aid,
- new policy that had financial implications,
- significantly decreased equalization,
- necessary contract settlements,
- districts experiencing declining enrollment, and
- so many more.
In this article, we are focusing on one of the reasons why districts may be struggling financially – student enrollment trends. MREA will look at the big picture of student enrollment over the years and then hone in on the post-Covid era.
As we look at trends in student enrollment in Minnesota, we know that the baby boomers provided the highest student count in 1972 of 921,957 Average Daily Membership (ADM). Since the boom in the late 1960’s and early 1970’s we have seen fluctuations in how many students attend public schools. Today, public schools have significantly less students (around 850,000 ADM, about an 8% decrease). This is important to consider because enrollment trends influence a district’s budget significantly. Most district revenue streams are based off student count. The state recognizes this and tries to lessen the blow of losing students with Declining Enrollment Aid. MDE’s Division of Finance has a good article on enrollment trends and how the state has been trying to deal with the overall declining enrollment in the state. While MDE uses ADM in the article, MREA uses Adjusted Pupil Units (APU) for most of its maps, because this is how district revenue streams typically are calculated.
For the following map, MREA considers FY20 as “pre-Covid.” In March 2020, we saw the start of Covid, but the student numbers should not have been affected much because it was so late in the year. For “post-Covid” MREA uses FY24 student numbers. This is a year where most distircts did not have major disruptions because of Covid. We also have accurate student numbers for FY24.
This MREA map shows pre-Covid vs post-Covid APU numbers, including which districts gained APUs.
When looking at the map, two-thirds of the districts in the state have not returned to pre-pandemic enrollment numbers. This may be one of the reasons we see many districts still cutting their budgets, even though they received an infusion of funding from the 2023 Legislative Session. The median district enrollment loss is 29 APU throughout the state. Districts represented on the map in red gained students post-Covid. Districts that gained students are spread throughout the state; there is not a clear pattern as to who gained students.
The following graphs show the total APU in the state from 2019 to 2025. The 2025 numbers are estimates. The first graph represents the preK-12 student APU including Charter Schools. The next two graphs show the charter schools separately.
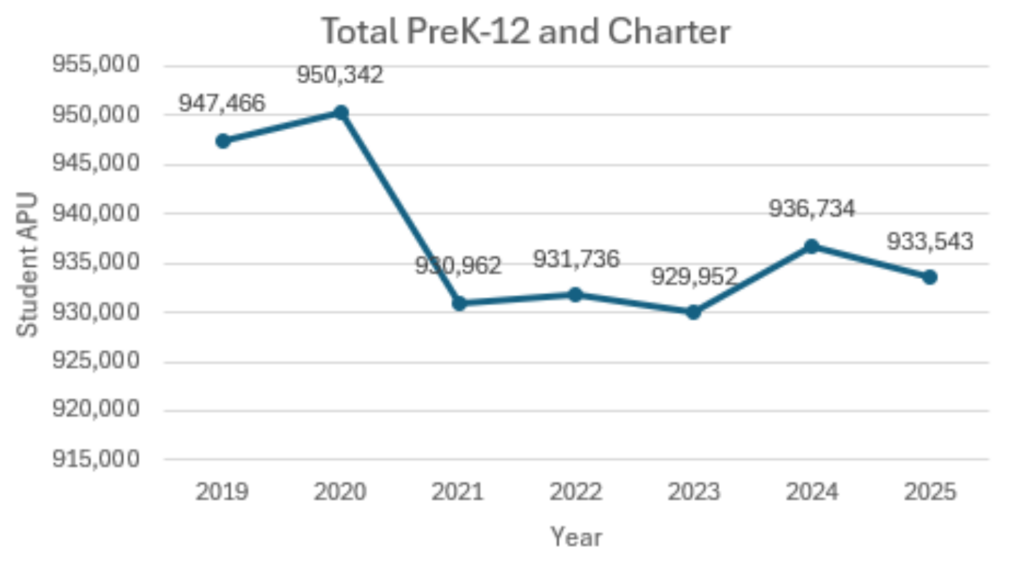
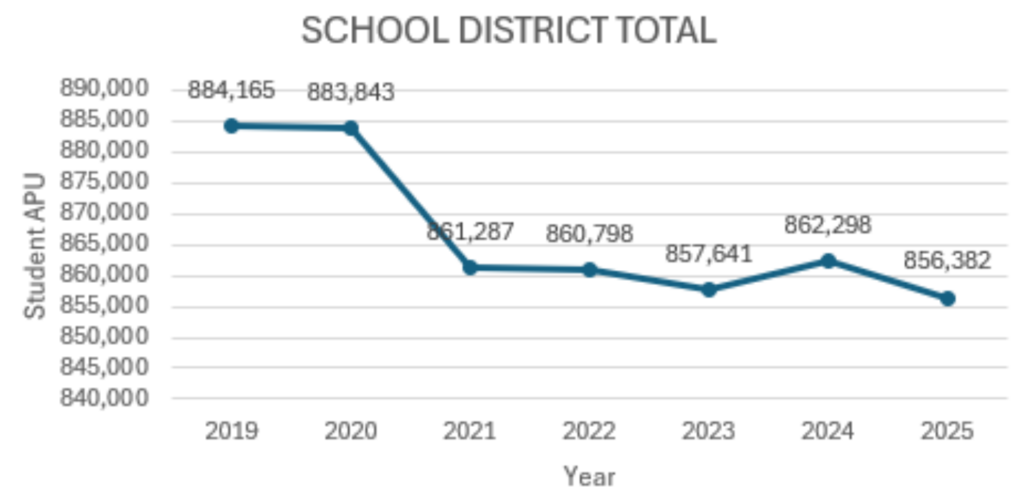
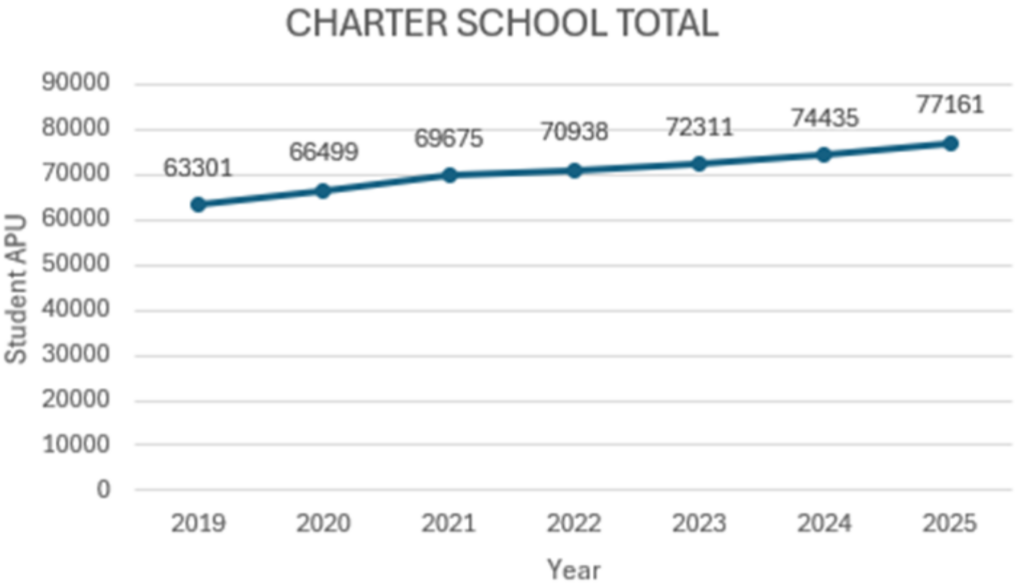
Overall, the Minnesota public schools have lost APU from FY20 to FY24. However, the Charter Schools have seen about a 12% increase in their APU from pre-Covid to post-Covid.
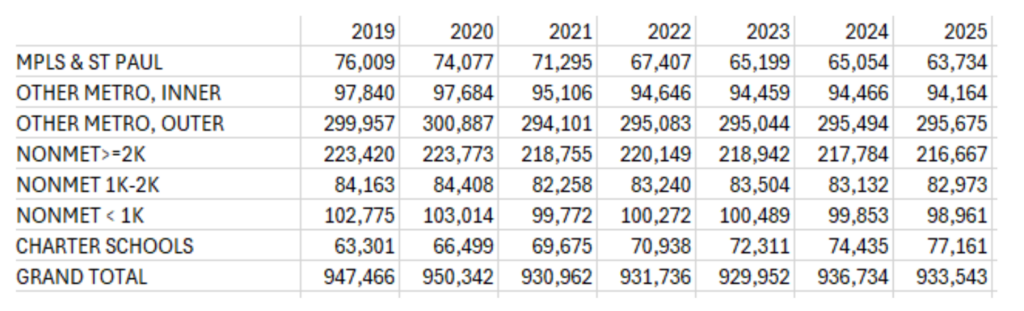
When breaking down the data into district types, as reflected in the chart below, data shows that every district type had decreased student enrollment from pre-Covid to post-Covid, except for charter schools.
There are more variables to consider than just Covid for student enrollment loss. It is possible that the entire state was predicted to lose students due to lower birth rates. Another variable may be that districts are losing their older students (count more for APU) and they are being replaced with younger students. Regardless of the cause, the declining enrollment correlates directly with decreased funding for most school districts and is a potential reason why some districts might be cutting their budgets now.